B2B marketing KPIs connect marketing activity to real business outcomes — like pipeline, revenue, and closed deals.
The difference between teams that prove marketing’s value and those that don’t often comes down to which objectives they track. And how they track them.
We’ve spent years running complex campaigns at Ninja Promo across industries with long sales cycles. This guide is built on what we’ve learned about B2B marketing metrics that truly matter.
How Unified B2B Marketing Metrics Support Cross-Team Collaboration
When marketing, sales, and operational teams track the same metrics, deals move faster, and revenue becomes more predictable. Every team influences the entire deal journey at different stages.
Here’s how sales and B2B marketing alignment plays out in practice:
- Marketing attracts a more relevant audience and helps increase lead-to-qualification rates.
- Sales shares insights from real prospect conversations, improving targeting, messaging, and customer journey mapping.
- Delivery and production teams provide operational data and case briefs that strengthen marketing narratives and sales credibility.
“Marketing brings the right potential customers into the funnel. The better a company understands its market, audience, and buyer behavior, the more efficient customer acquisition becomes. When marketing attracts the right leads and sales responds quickly, the win rate improves. Long-term pipeline growth happens when the delivery team delivers on the promised value. Marketing, sales, and delivery together drive long-term profitability.”
Maya Miller, Strategist at Ninja Promo
As a result, you’re building shared ownership of metrics like CAC and ROMI across teams that previously had no visibility into each other’s work.
Vanity Metrics vs. Real Results: Why B2B Marketers Should Look Deeper
Vanity metrics like website visits, bounce rate, email open rates, and form fills help you track progress. But they just can’t stand alone as proof that marketing is working.
The problem shows up when they become the primary lens. A campaign might look strong on a traditional dashboard while the pipeline stays thin and deals rarely close.
“Engagement metrics are early demand signals that help forecast revenue potential. What matters is not traffic volume, but whether the right audience enters the funnel and moves to the next stages. They become truly valuable only when they reflect qualified demand and translate into pipeline growth.”
Maya Miller, Strategist at Ninja Promo
Here’s how this gap might look in practice:
- A content campaign drives 50,000 monthly visits, and organic traffic is up 40%, but the leads coming in are early-stage researchers with no buying intent — sales spends more time qualifying out than closing.
- Form fills spike after a gated report launch, but 80% of submissions came from students and junior specialists vs qualified leads.
You get the idea.
The end B2B marketing KPIs should be tied to outcomes like pipeline generated and revenue closed. Vanity metrics are there to showcase early signals and support the overall narrative.
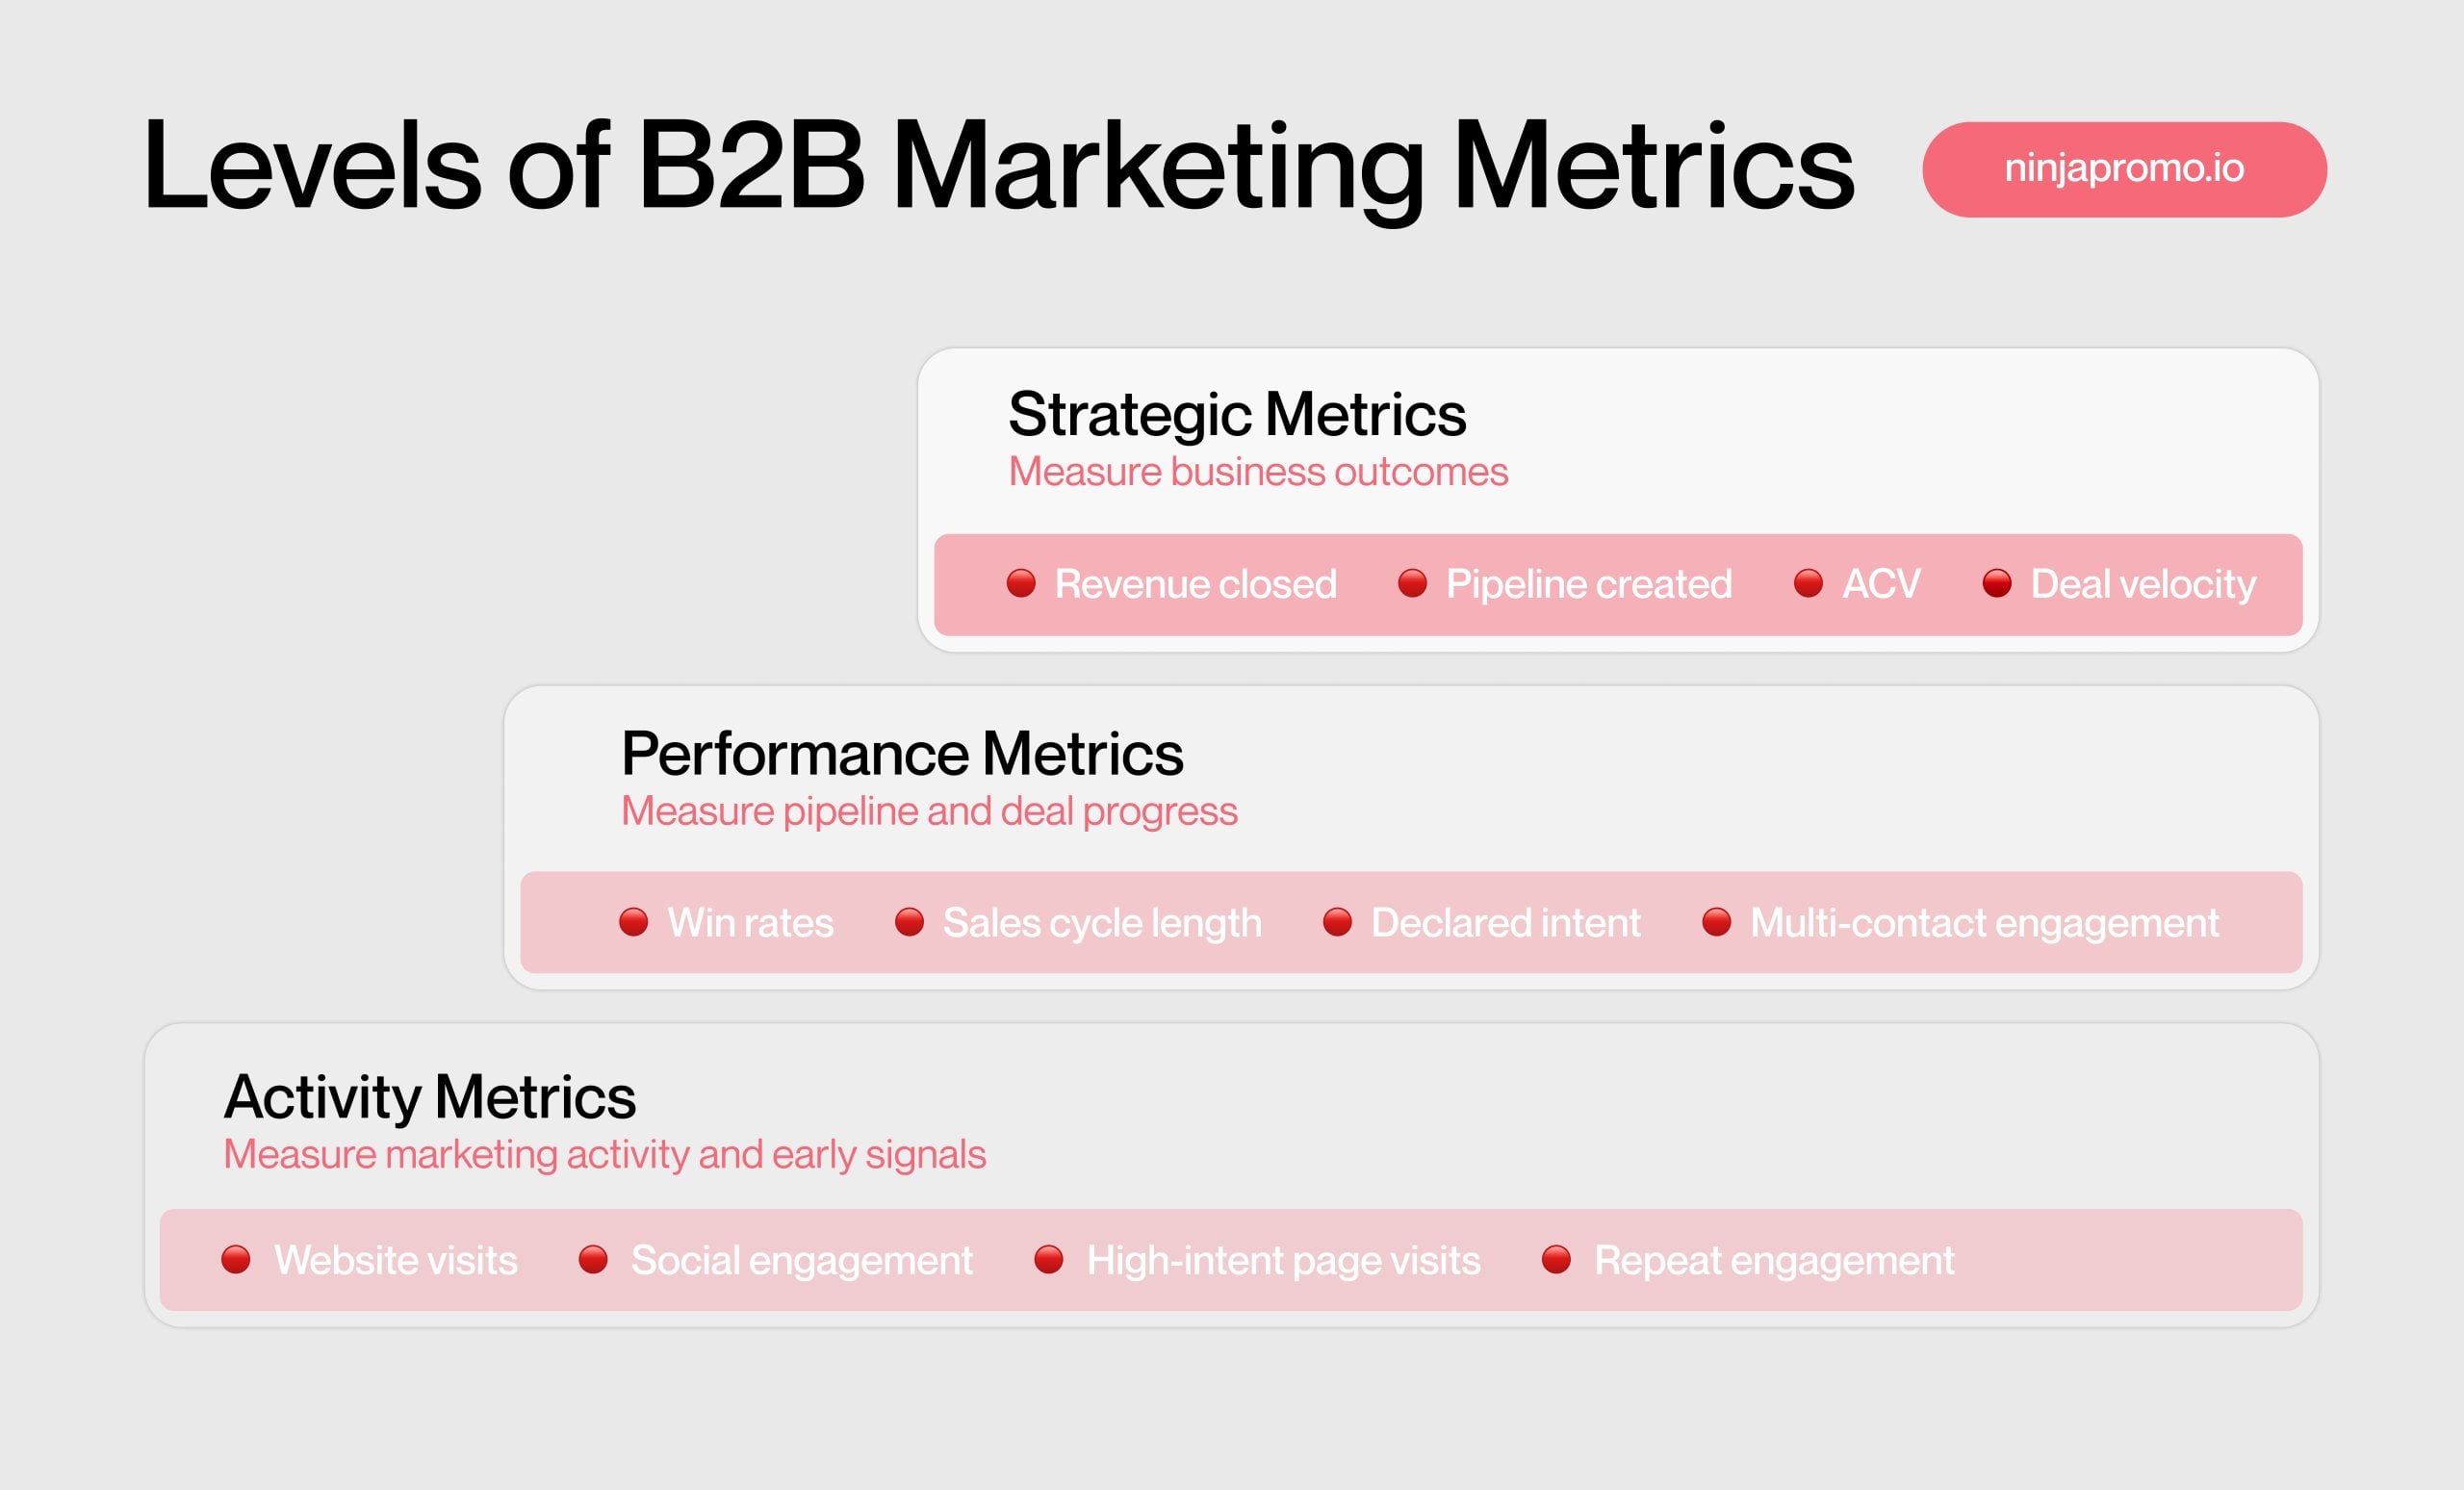
11 Examples of B2B Marketing KPIs & Metrics Worth Tracking
Tracking the right B2B marketing performance indicators separates teams that influence real revenue from teams that report on activity. Below, we cover key metrics that influence pipeline, intent, and engagement.
This is a subset, not an exhaustive list. The point is: moving away from vanity metrics toward numbers your CFO and sales lead actually care about.
| Metric | What it helps track in B2B marketing |
| Pipeline created | The volume and value of qualified opportunities marketing contribute to the funnel. |
| Revenue closed | Marketing’s direct contribution to revenue. Tracks which campaigns, channels, and content types influenced deals that actually closed. |
| Average contract value (ACV) | Whether marketing is attracting accounts that match your target segment in size, industry, and willingness to pay. |
| Sales cycle length | How long it takes from the first marketing touchpoint to a closed deal, and where in that journey prospects tend to get stuck. |
| Win rates | What percentage of marketing-sourced pipeline converts, and how that compares to outbound-sourced deals. |
| High-intent page visits | Which accounts are researching marketing assets and pages with pricing, comparisons, and use cases. |
| Declared intent (demo requests) | Prospects who have moved past research and are ready to evaluate your product against alternatives. |
| Repeat engagement | Prospects returning to key pages or content multiple times, which correlates with deals that are less likely to go dark. |
| Multi-contact engagement | How many people within the same account are engaging with marketing content, a stronger signal than a single interested contact. |
| Brand search lift | The measurable increase in searches for your brand name during and after a campaign, separate from paid or direct traffic. |
| ICP social interactions | Likes, comments, shares, and saves from accounts that match your ICP, filtered from broader vanity engagement. |
Let’s look at each of these KPIs in detail.
1. Pipeline Created
Pipeline created measures the total value of qualified opportunities that marketing directly generates for sales.
It’s the most direct way to connect B2B marketing goals to commercial output. A high lead volume means nothing if the opportunities don’t meet the threshold sales considers worth pursuing. That’s why pipeline value matters more than lead count.
To track it properly:
- Set a minimum deal value that qualifies an opportunity as real pipeline, agreed between marketing and sales.
- Attribute pipeline to marketing sources using multi-touch attribution, which distributes credit across every campaign and channel that contributed to the opportunity.
- Review pipeline quality regularly with sales to make sure marketing brings in qualified prospects.
2. Revenue Closed
Revenue closed measures the business revenue that can be traced back to marketing-sourced or influenced opportunities. It’s the clearest metric for aligning marketing performance with overall business objectives.
Here’s how to measure B2B marketing performance on this metric:
- Use CRM attribution to connect closed deals back to marketing campaigns and assets.
- Review closed revenue by channel and campaign quarterly to identify which sources consistently produce the highest-value deals.
- Compare against marketing benchmarks for your industry and deal size to assess your B2B marketing strategy performance.
✅Pro tip: In B2B SaaS, it’s also important to track MRR (monthly recurring revenue) and ARR (annual recurring revenue) attributed to marketing-sourced deals. MRR measures predictable monthly income, and ARR projects that across a year.
3. Average Contract Value (ACV)
Average contract value is the mean value of all marketing-influenced contracts signed within a given period. It shows whether marketing is attracting the right accounts and demonstrates the quality of leads.
For strategic marketing planning, track ACV alongside pipeline volume to spot when lead quality is slipping:
- Set an ACV target that reflects your ideal customer segment and use it to filter pipeline reporting.
- Compare ACV by channel and campaign to identify which sources attract higher-value accounts.
- Use ACV trends over time to track whether you’re reaching your B2B marketing goals.
“I distinguish real marketing-generated pipeline from inflated pipeline by one key factor: its ability to move through the funnel and convert into revenue. If an opportunity sits in the CRM but stalls early, fails qualification, or never becomes a meaningful sales conversation, it’s not pipeline—it’s noise. Real pipeline is defined by quality, not volume: strong target fit, clear buying intent, healthy conversion rates, and contribution to closed-won revenue.”
Maya Miller, Strategist at Ninja Promo
4. Sales Cycle Length
Sales cycle length is the average time between a prospect’s first marketing touch and a closed deal.
Marketing has more influence over this number than most teams realize.
For example, poor targeting brings in accounts that take forever to move because they were never quite the right fit. While effective sales enablement materials and smart nurturing can help move the right prospects forward faster.
5. Win rates
Win rate is the percentage of marketing-sourced opportunities that convert to closed deals.
It’s a direct signal of pipeline quality. For example, a declining win rate while pipeline volume stays steady usually points to a targeting problem.
Make sure to track inbound and outbound win rates separately to understand where to invest in B2B marketing channels.
6. High-Intent Page Visits
High-intent page visits track how many times target accounts visit pages that indicate active buying research, such as pricing, comparison, and use case pages.
These visits are early pipeline signals that show up before a prospect becomes a lead, making them useful for predictive pipeline forecasting and lead scoring.
You can use advanced analytics tools like Clearbit to automate this part of the analysis.

7. Declared Intent (Demo Requests)
Declared intent measures the volume and quality of prospects who have requested a demo or sales conversation.
This is a prospect telling you directly they want to evaluate your solution, which makes it one of the key marketing benchmarks.

In PLG environments, marketing teams also track direct product sign-ups, trials, and purchases.
8. Repeat Engagement
Repeat engagement tracks how often a prospect returns to your content or website across multiple sessions.
Multiple visits to the same or related content usually mean someone is actively evaluating. This makes repeat engagement one of the stronger campaign performance tracking signals at early stages.
“Real buying intent is usually visible through repeated high-intent behaviors, not isolated touchpoints. When a prospect returns to the site, visits pricing, case studies, or service pages, and explores implementation details or expected outcomes, it signals active evaluation rather than casual interest.”
Maya Miller, Strategist at Ninja Promo
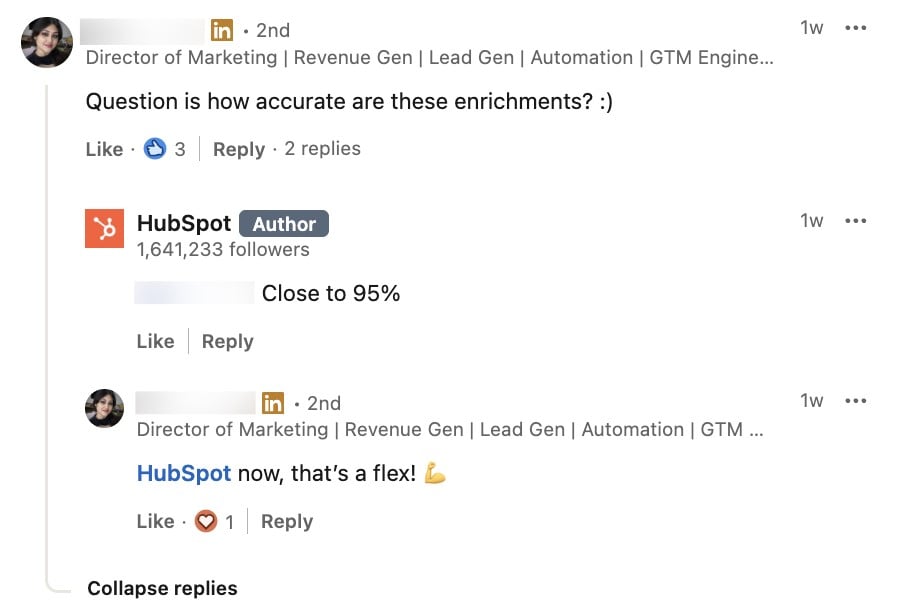
Tools like HubSpot help you get a holistic view of this metric:
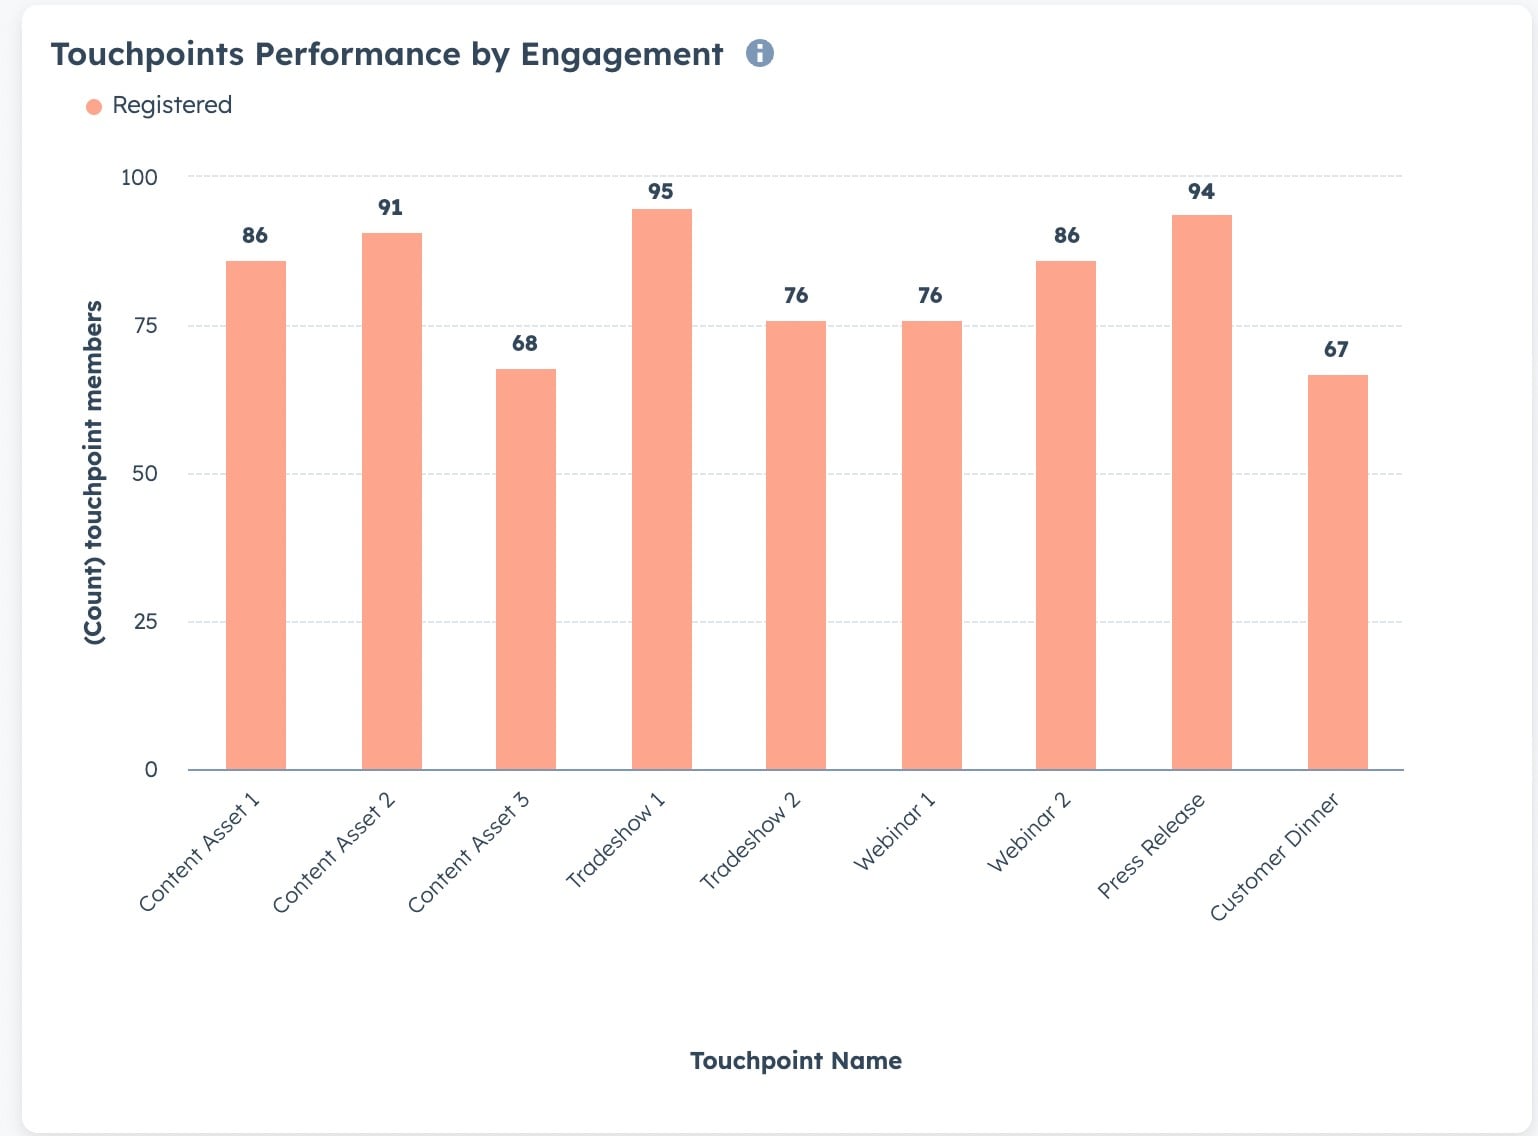
Source: Revops global
9. Multi-Contact Engagement
Multi-contact engagement tracks how many people within the same target account are interacting with your marketing content.
When multiple stakeholders from the same account are engaging with your assers, it might indicate that the buying conversation is already happening internally.
10. Brand Search Lift
Brand search lift measures the increase in direct searches for your brand name following a campaign. You can track in Google Search Console → Search results → Add a filter → Query → Branded queries.
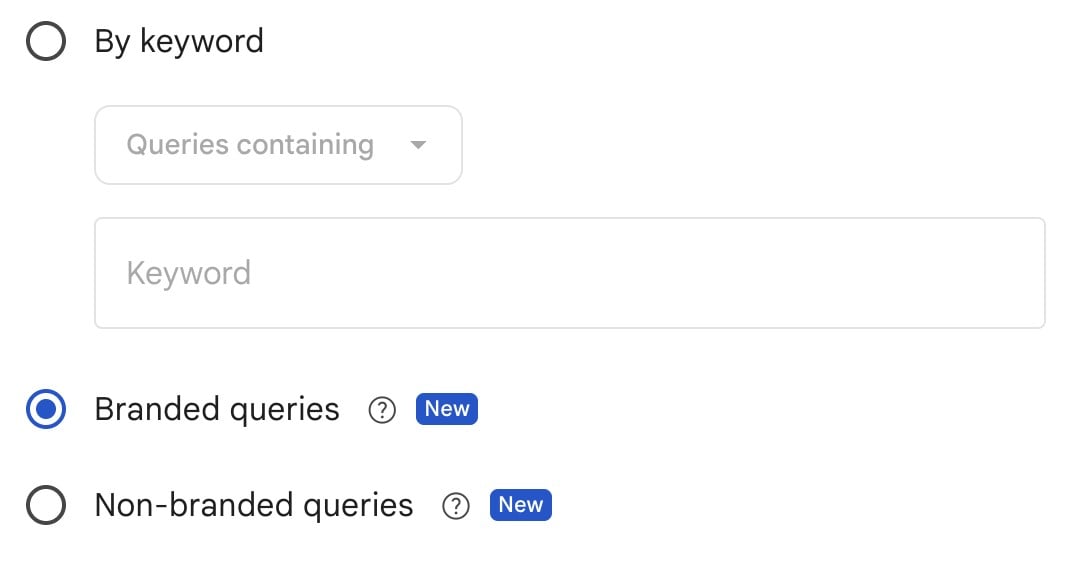
This data shows whether your brand marketing, AI visibility, and campaign efforts are paying off.
11. ICP Social Interactions
ICP social interactions measure likes, shares, and comments on your social content from people at companies that match your ideal customer profile.
It’s a great way to showcase that your marketing content is reaching and engaging the right audience.
Depending on the content formats you’re using, you might also track whether prospects mention your podcast, video content, reports, etc., when starting conversations with sales.
How to Structure Your B2B Marketing Metrics for Maximum Clarity
To structure B2B marketing measurement effectively, organize metrics by audience, funnel stage, and reporting frequency.
This helps identify patterns in your data, generate hypotheses for effective experiments, and ensure transparency across teams.
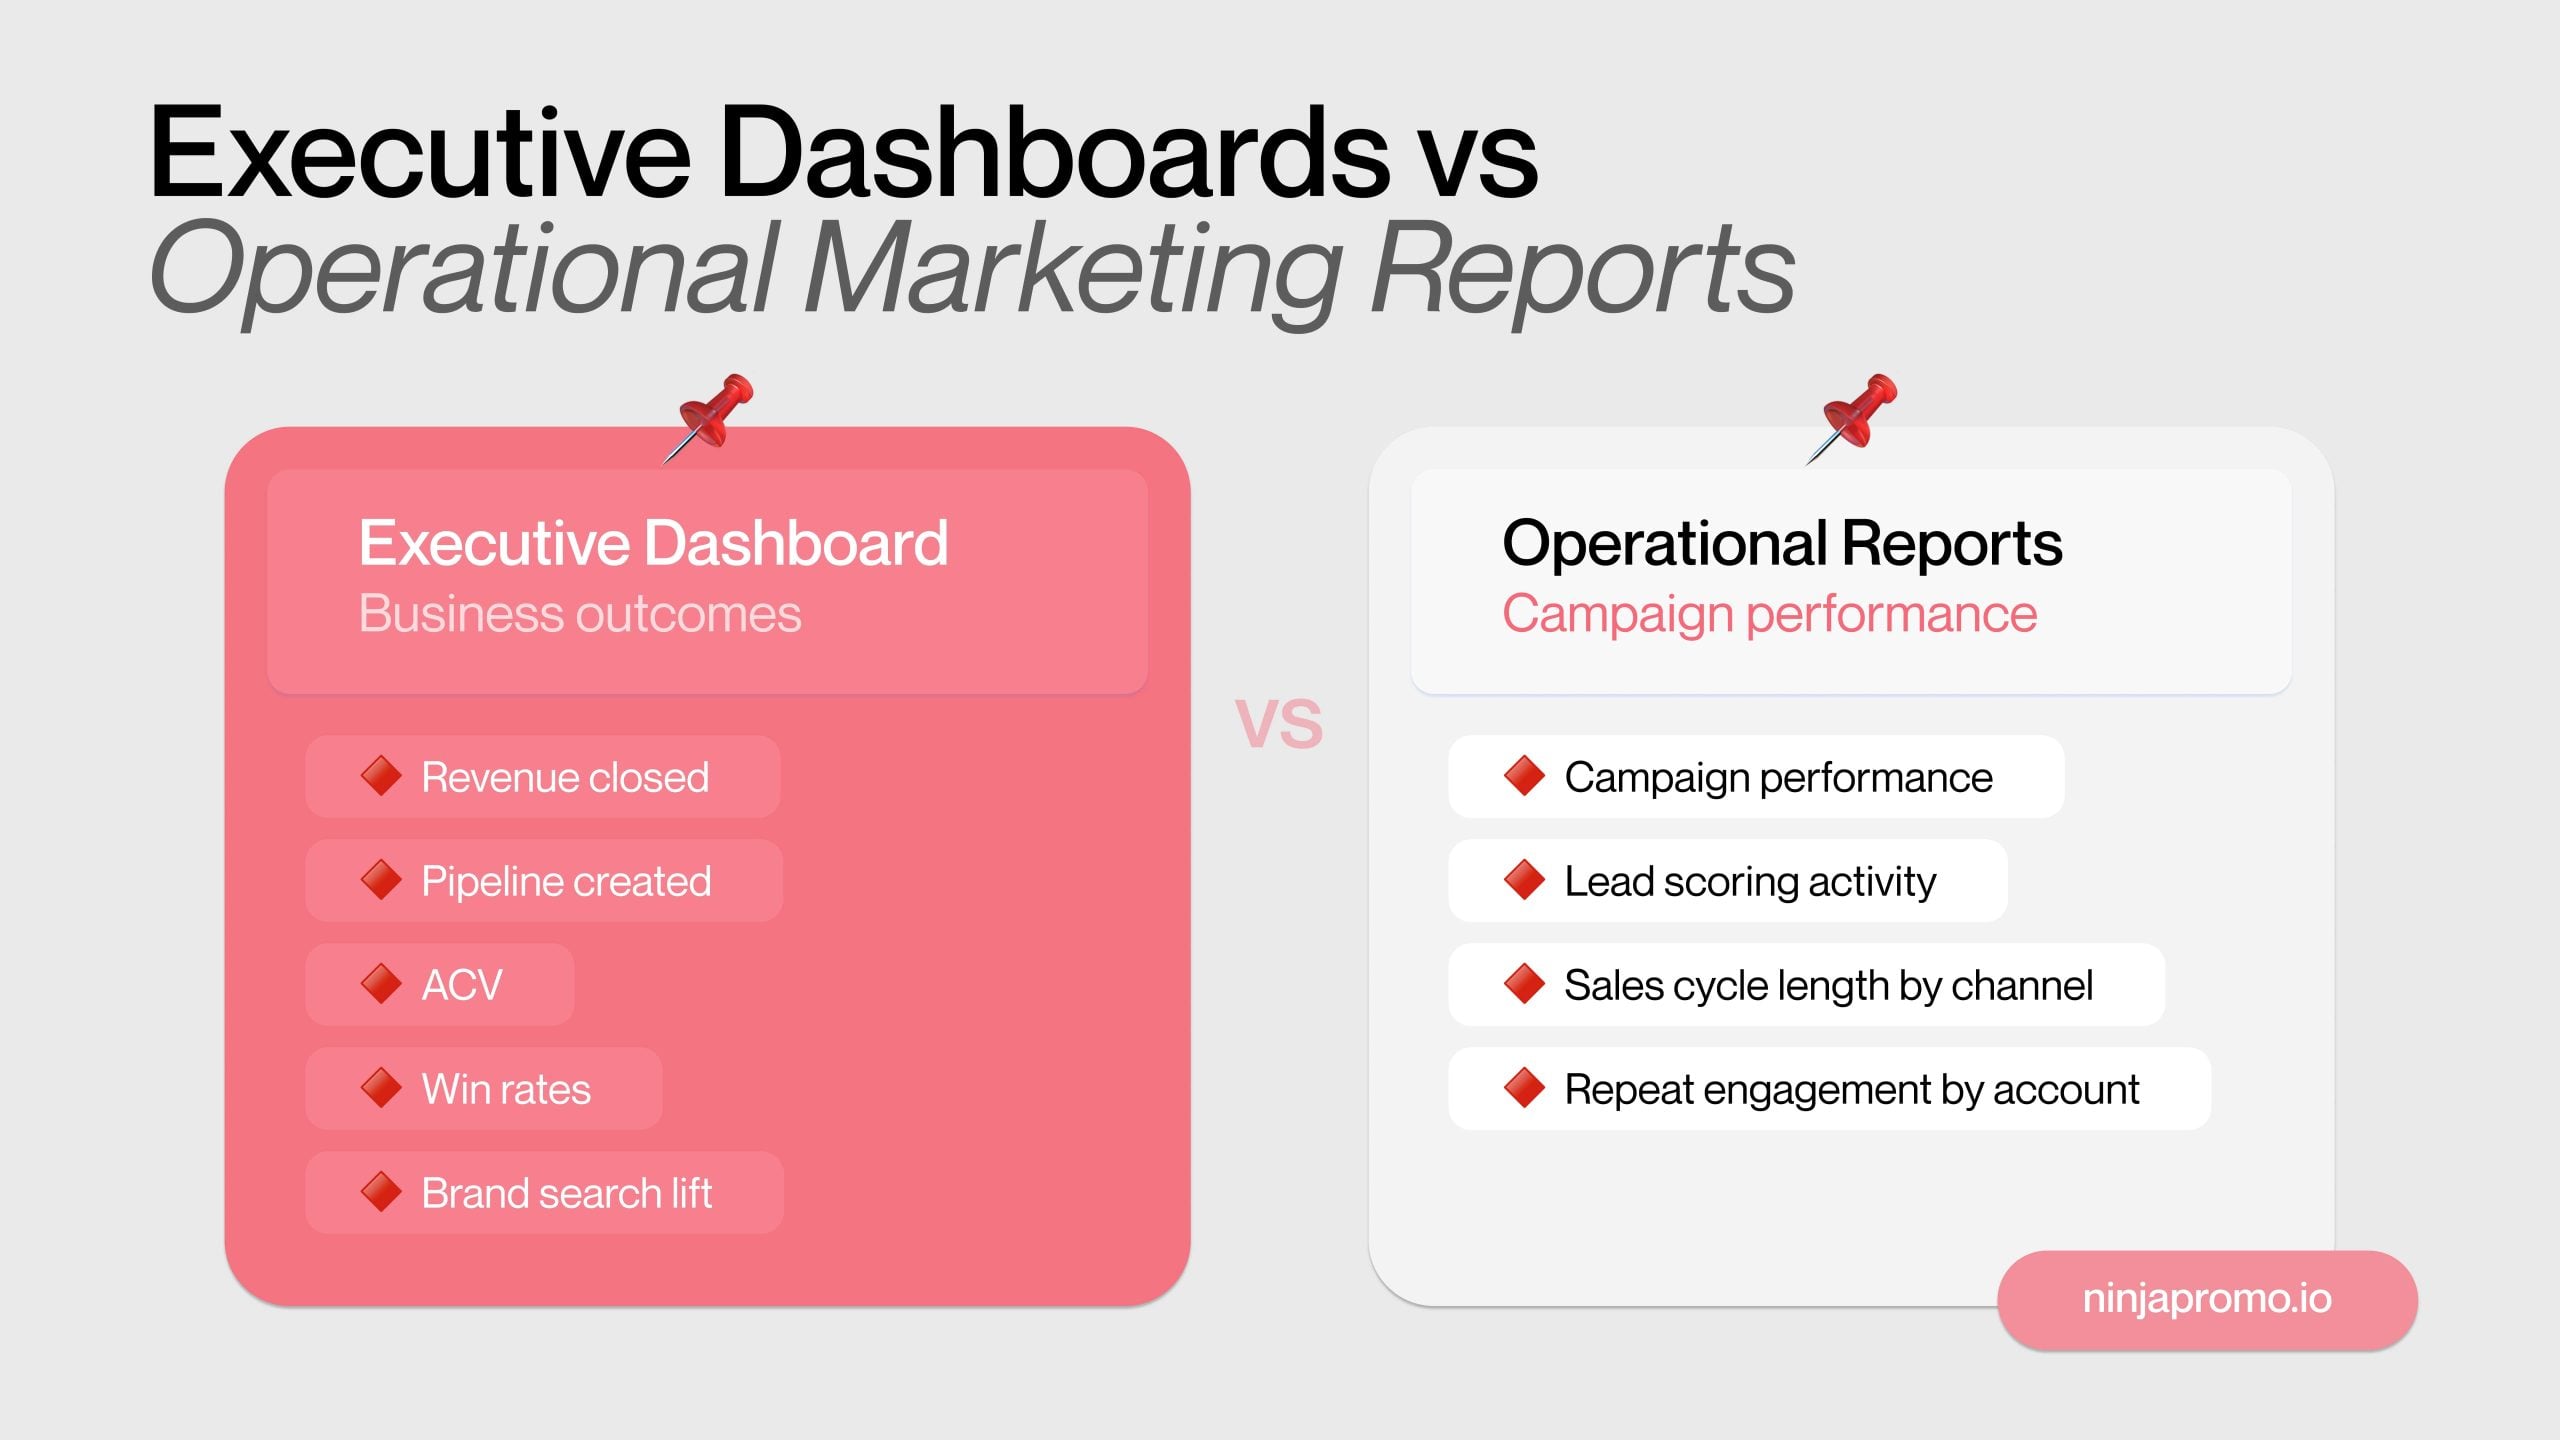
Executive Dashboard vs. Operational Reports
First, make sure to separate executive dashboards and operational reports as they serve different audiences and goals.
Executives prioritize strategic marketing reporting — revenue impact and business growth measurement. Operators need the granular data that explains why those numbers look the way they do.
“End-to-end analytics is one of the most valuable parts of the sales process. It is not always fully achievable, especially with long sales cycles, but it should remain the benchmark. You need clear visibility into every stage of the funnel through data. When that is combined with regular performance reviews (daily or weekly, depending on the business need) and each specialist is accountable for their own metrics, leadership can stay focused on revenue while teams manage the operational drivers behind it.”
Maya Miller, Strategist at Ninja Promo
Here’s what it looks like in terms of metrics:
- Executive dashboards: revenue closed, pipeline created, ACV, win rates, brand search lift
- Operational reports: campaign-level performance, lead scoring activity, cycle length by channel, repeat engagement by account
Organizing Metrics by Funnel Stage, Region, Segment, and Channel
Assign every metric to a B2B marketing funnel stage, region, and channel to pinpoint where performance breaks down rather than just that it did. Look at:
- Top of funnel: ICP social interactions, brand search lift, high-intent page visits
- Mid funnel: repeat engagement, multi-contact engagement, declared intent
- Bottom of funnel: pipeline created, win rates, sales cycle length, deal velocity
- Differences across customer segments, regions, and distribution channels
Reporting Frequency: Weekly, Monthly, and Quarterly KPIs
Establish a reporting frequency that helps you identify meaningful patterns in the data without overloading your teams. For example:
- Weekly: campaign performance, declared intent, high-intent page visits
- Monthly: pipeline created, win rates, sales cycle length, ACV
- Quarterly: revenue closed, brand search lift, ARR/MRR contribution
Remember, you don’t need to track every metric available. Instead, focus on the ones that provide real insights you can act on.
Final Thoughts
Focusing on the right B2B marketing KPIs comes down to one thing: connecting marketing activity to real business results and revenue. The metrics in this guide might not all apply to every business. But the principle behind them does. Focus on pipeline quality over lead volume, on deal outcomes over engagement rates, connect metrics to meaningful outcomes, and communicate these insights clearly across teams.