
Marketing spend relative to revenue is the share of your revenue allocated to marketing to help your business grow. There is no single “right” number for a company. If you’re asking yourself, “how much should a company spend on marketing?” You’ll be interested to learn that the percentage depends on your goals, your stage of growth, and your market’s competitiveness.
Why There Is No One-Size-Fits-All Marketing Percentage
There is no universal percentage because marketing spending depends on many variables, including your market position, audience, and priorities. What influences marketing budget decisions often comes down to:
- Company size
- Industry
- Business goals
- Growth stage
A startup trying to build awareness typically needs a different percentage than an established brand defending its market share.
Goals matter too, they are one of the biggest factors that influence markeitng spending. Building a pipeline, launching a new product, entering a new region, or improving retention all require different levels of investment. This is why recommended marketing spend can look very different from one company to the next, even at the same revenue level.
A fixed percentage also can’t capture what makes your business unique, such as your market position, your audience, and your strategy. Two companies with the same revenue can have very different competition, sales cycles, and channels. That is why your marketing budget should be set based on your real situation, not a one-size-fits-all benchmark.
Average Marketing Budget Benchmarks by Industry and Company Size
Rather than copying a benchmark, treat it like a starting point, not a rule. These numbers show what companies report spending on marketing relative to revenue, which can help you estimate an average marketing budget and test your plan.
However, understanding what other companies in similar positions are doing can give you a good place to start. Use these ranges to guide marketing spending decisions, not to copy a competitor’s exact playbook.
| Industry (CMO Survey sector) | Typical marketing spend (% of revenue) |
| Education | 24.07% |
| Healthcare | 7.56% |
| Tech / Software / Platform | 9.04% |
| Professional Services | 4.20% |
| Manufacturing | 2.46% |
| Retail / Wholesale | 5.50% |
| Transportation | 1.06% |
Source: https://cmosurvey.org/cmosurvey_results/The_CMO_Survey-Firm_and_Industry_Breakout_Report-2025.pdf page 38
These benchmarks help you sanity-check your budget. For example, Education tends to run higher marketing spend as a share of revenue because it often depends on steady awareness-building and ongoing enrollment demand. Healthcare and Tech/Software usually sit closer to the middle, where budgets are shaped by competition, trust, and longer decision cycles. On the lower end, sectors like Manufacturing and Transportation often spend less as a percentage of revenue because growth relies more on existing relationships, sales-led efforts, or operational capacity than broad-reach marketing.
| Company revenue | Typical marketing spend (% of revenue) |
| Under $10M | 17.0% |
| $10M–$25M | 21.5% |
| $26M–$99M | 8.3% |
| $100M–$499M | 8.5% |
| $500M–$999M | 7.3% |
| $1B–$9.9B | 7.2% |
| $10B+ | 4.9% |
Source: https://cmosurvey.org/cmosurvey_results/The_CMO_Survey-Highlights_and_Insights_Report-2025.pdf (page 22)
This table shows a common pattern. Smaller companies often spend a higher percentage because they are still building awareness, pipeline, and a repeatable growth engine. Larger companies usually spend a lower percentage because revenue is higher, growth is steadier, and brand awareness is already established.

Red Flags That Show You’re Underinvesting or Overspending on Marketing
An optimal marketing budget is not just about how much you spend. It is about balancing marketing spend and profitability while also balancing growth and digital marketing costs. These red flags will help you spot when your budget is too small to support growth or too large relative to the returns you are getting, which is key to aligning budget with business goals. To get better results without simply increasing spend, focus on how you align sales and marketing around shared targets and lead quality.
Related Content: What is a digital marketing campaign?
Signs of Underinvestment
Here’s a quick breakdown of the most common signs of underinvestment, how to spot them, and why they matter.
| Sign | What it looks like | Why it hurt growth |
| Pipeline is flat or shrinking | Lead flow is inconsistent, and sales have “dead weeks” | Fewer qualified opportunities mean slower revenue growth |
| You rely on referrals or one channel | One source drives most leads | Growth becomes hard to scale on demand |
| Low brand awareness | Prospects do not recognize you, and trust is low | You lose deals to competitors or have to offer discounts to win |
| Weak website and content | High bounce rates, low conversion rates | Interest does not turn into leads, and buyers drop off |
| No room to test and improve | Little testing, slow iteration, outdated messaging | Performance stalls and costs rise over time |
“It’s a red flag when growth comes almost entirely from referrals and existing clients. If the sales team says every lead arrives cold and needs to be educated from scratch, that’s already a warning sign. And if you don’t even know your CAC, it usually means marketing isn’t bringing in enough new customers to measure.”
Vincent N, Lead Strategist at Ninja Promo
Warning Signs of Overspending
Now here’s a breakdown of the same thing, but with over-investing, rather than under.
| Sign | What it looks like | Why it hurts ROI |
| Spend increases, results do not | Budget grows but pipeline, revenue, or conversions stay the same | You are paying more without getting more back |
| CAC keeps climbing | Cost per lead or customer rises month over month | Margins shrink and scaling becomes risky |
| High volume, low quality leads | Plenty of leads, but they don’t turn into sales | Sales time is wasted and close rates drop |
| Tool and vendor overload | Too many platforms, agencies, and reports that don’t show real impact | Costs rise from overlap and complexity |
| Scaling without a stable funnel | Ads scale up, but conversion rates and follow-up are inconsistent | More spend amplifies losses instead of performance |
“You might be spending too much when CAC keeps climbing, but lead volume doesn’t follow. You’re launching new channels not because existing ones are saturated, but because the budget needs somewhere to go.”
Vincent N, Lead Strategist at Ninja Promo
There are also some other red flags to look out for, which include:
“Brand spend is growing, but nobody can roughly explain how it connects to revenue. And when marketing has quietly become the events-and-merch department with beautiful reports attached, that’s a reliable sign money is leaking.”
Vincent N, Lead Strategist at Ninja Promo
Quick Self-Assessment Checklist
Use this quick checklist to see, in under a minute, whether you are underinvesting, overspending, or spending at the right level for your growth goals.
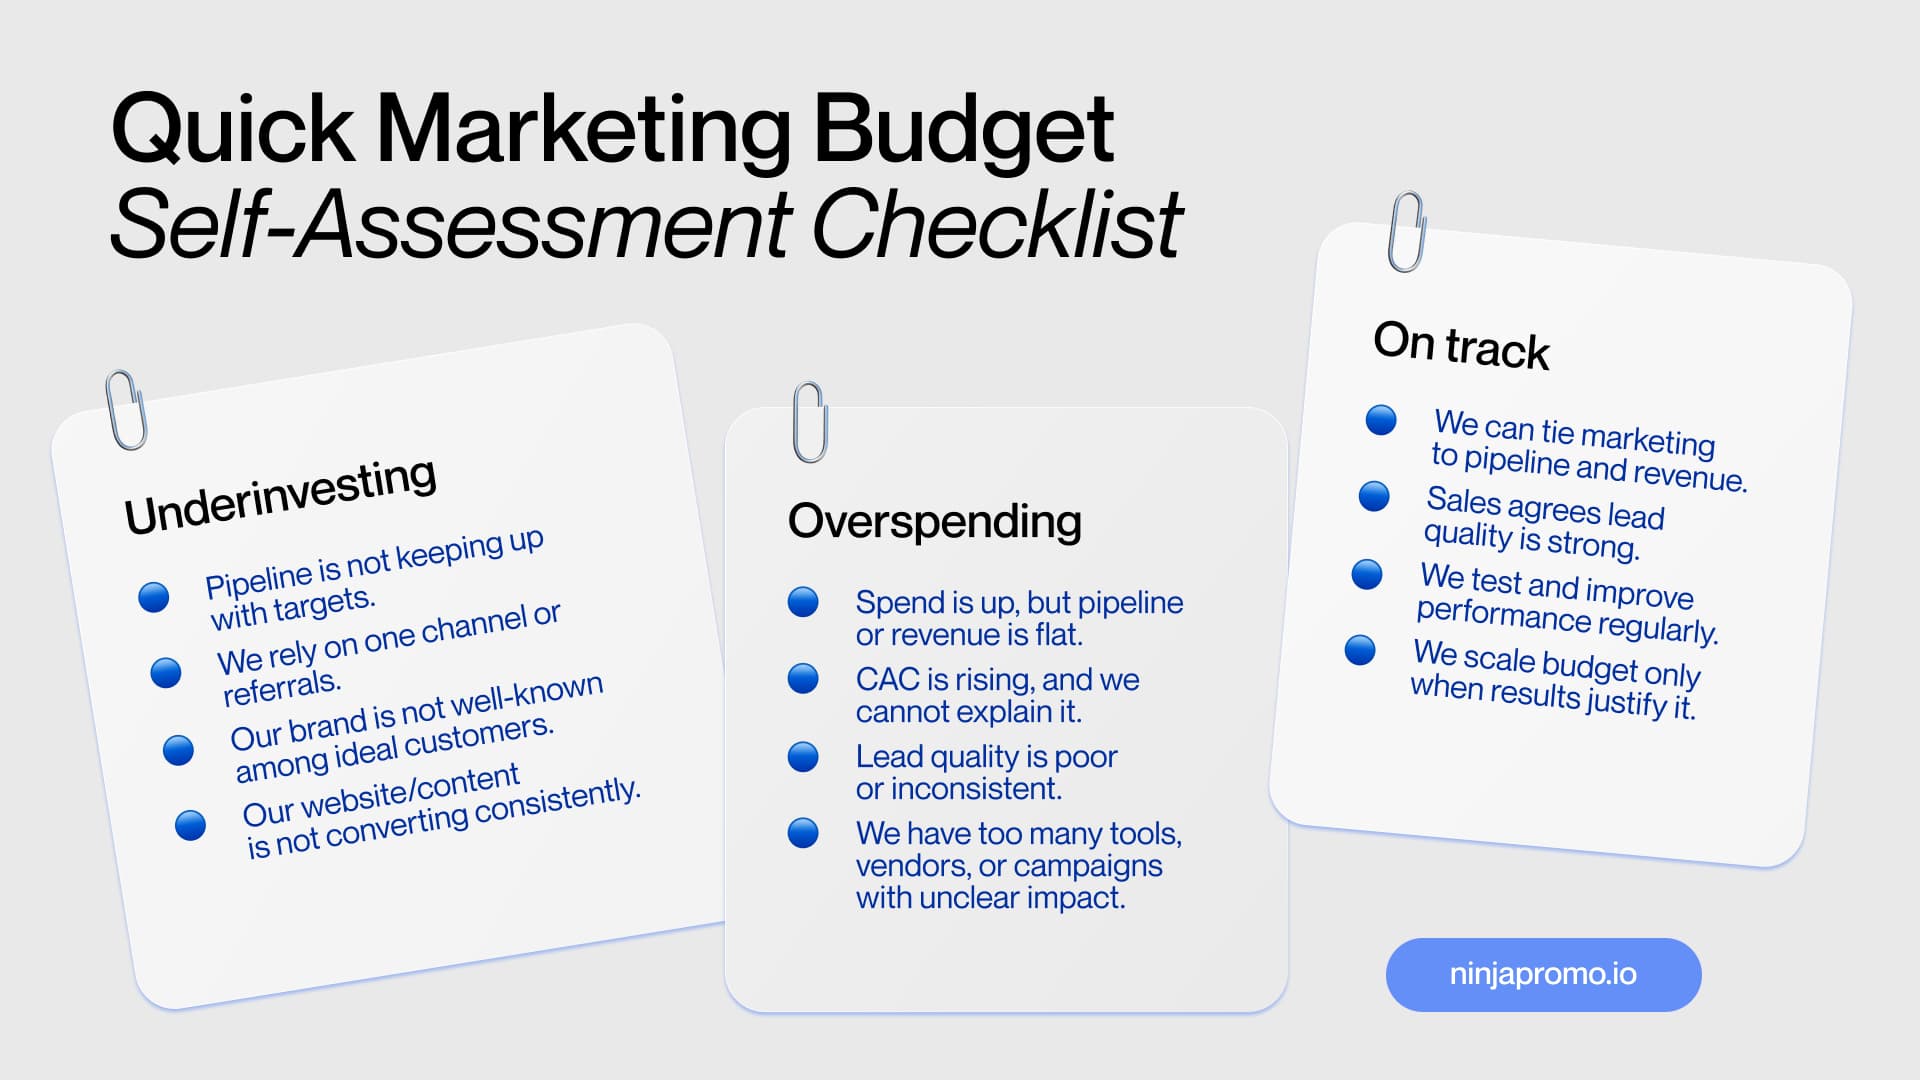
Underinvesting
☐ Pipeline is not keeping up with targets.
☐ We rely on one channel or referrals.
☐ Our brand is not well-known among ideal customers.
☐ Our website/content is not converting consistently.
Overspending
☐ Marketing spending is up, but pipeline or revenue is flat.
☐ CAC is rising, and we cannot explain it.
☐ Lead quality is poor or inconsistent.
☐ We have too many tools, vendors, or campaigns with unclear impact.
On track
☐ We can tie marketing to pipeline and revenue.
☐ Sales agrees lead quality is strong.
☐ We test and improve performance regularly.
☐ We scale marketing budget allocation only when results justify it.
Quick read:
- 3+ checks in Underinvesting: increase coverage (channels, content, demand gen).
- 3+ checks in Overspending: fix targeting, funnel, or measurement before scaling.
- 3+ checks in On track: keep steady, optimize, and scale carefully.
Proven Approaches to Setting Your Marketing Budget
There is more than one “right” way to set a budget. The best method depends on how predictable your revenue is, how fast you need to grow, and how clearly you can track results. This section shows how to determine your budget using a practical marketing investment strategy, including budget allocation and strategic resource allocation, so spending supports results rather than guesswork.
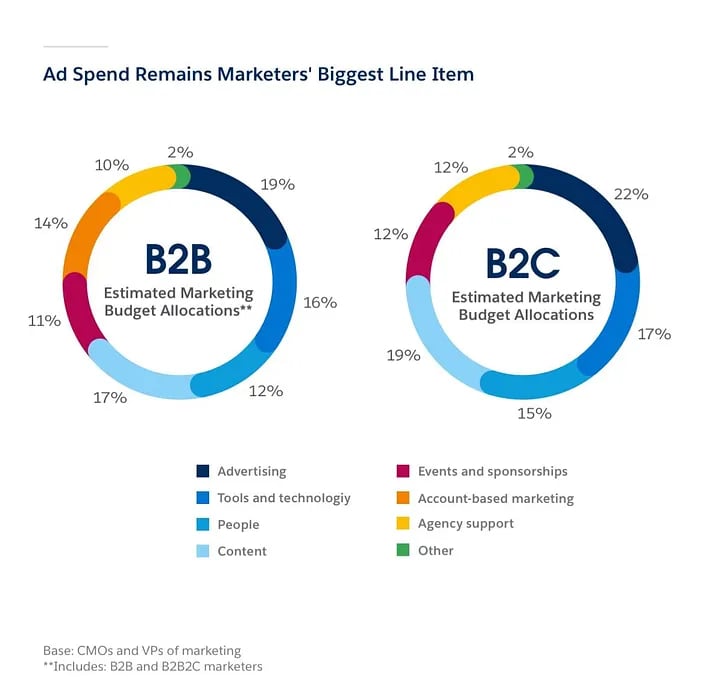
“There’s no universal number, but honest benchmarks exist. For example, mature B2B businesses focused on retention typically spend up to 5-7% of revenue. Mature B2C in a stable market sits around 10%. Startups or businesses entering a new market often need 20-50%, at least for a while.”
Wondering what matters then?
“The percentage matters less than your LTV: CAC ratio. If a customer is worth $300 over their lifetime and costs $100 to acquire, that’s a healthy business. If it’s the other way around, no percentage of revenue fixes that. Goals and unit economics are the actual strategy; revenue share is secondary, “
1. Percentage of revenue method
💡 Idea: Set a fixed marketing spend.
🚀 What it involves: You pick a percent and apply it to last year’s revenue or next year’s forecast.
✅ How to implement:
- Choose a revenue number (last 12 months or next 12 months forecast).
- Set a realistic percent based on your stage and goals.
- Review quarterly and adjust if revenue changes.
🏆 Best for: Stable businesses that want simple planning.
📈 Watch out for: Underfunding growth when you need to scale fast.
“While this method works when the business is stable, it often fails during periods of growth or decline because the budget shrinks exactly when revenue dips and marketing support is needed the most.”
Vincent N, Lead Strategist at Ninja Promo
2. Goal-based, also called objective-and-task
💡 Idea: Fund the outcomes first, then total the cost.
🚀 What it involves: You decide targets (pipeline, leads, trials, demos), then budget for the work needed to hit them.
✅ How to implement:
- Define a target (example: pipeline goal for the next quarter).
- Map the activities needed (ads, content, events, email, SEO).
- Estimate costs for each activity and add a testing buffer.
🏆 Best for: Growth-focused teams that track performance.
📈 Watch out for: Needs data and time to plan.
Are you looking for the most strategic method?
“A more strategic approach is to reverse-engineer the budget from business goals. For example, if a company wants to acquire 500 new customers in a year and its website converts at 2 percent, it would need around 25,000 visits. If the average cost of acquiring one visit is known, multiplying that cost by the required traffic produces a realistic marketing budget, turning marketing into a measurable investment rather than just an expense line.”
Vincent N, Lead Strategist at Ninja Promo
3. Unit economics model (CAC and LTV)
💡 Idea: Spend based on what you can afford to pay for a customer.
🚀 What it involves: You use Customer Acquisition Cost (CAC), Customer Lifetime Value (LTV), and margins to set guidelines.
✅ How to implement:
- Calculate your target CAC based on margins and payback period.
- Forecast how many customers you need.
- Use a budget that keeps the target CAC in mind.
🏆 Best for: Performance marketing and subscription businesses.
📈 Watch out for: Poor tracking, which makes this unreliable.
4. Competitive parity method
💡 Idea: Match what competitors spend so you don’t fall behind.
🚀 What it involves: You use public reports, ad libraries, tools, and market signals to estimate competitor investment.
✅ How to implement:
- Identify your closest competitors.
- Estimate their channel focus and how much they are spending.
- Set a budget that keeps you competitive.
🏆 Best for: Crowded markets where share of voice matters.
📈 Watch out for: Competitors can waste money too.
“Another approach is matching competitor spending, which can be risky because companies rarely know their competitors’ channel mix, efficiency, unit economics, or strategic goals, meaning they may simply copy ineffective decisions. Some businesses also allocate whatever funds remain after covering other expenses, a method that helps maintain operations but rarely supports meaningful growth.”
Vincent N, Lead Strategist at Ninja Promo
5. Zero-based budgeting
💡 Idea: Rebuild the budget from zero every cycle.
🚀 What it involves: Nothing is “approved by default.” Every line item must earn its place.
✅ How to implement:
- List the channels and programs you want to run.
- Justify each cost with expected impact and owner.
- Cut or pause items that don’t tie in with goals.
🏆 Best for: Teams that need efficiency fast.
📈 Watch out for: It can slow execution if you overdo reviews.
6. Test-and-scale budget
💡 Idea: Start small, prove performance, then increase spend.
🚀 What it involves: A planned test budget for messaging, creative, and channel fit.
✅ How to implement:
- Set aside a fixed test budget for 4 to 8 weeks.
- Define success metrics before you launch.
- Scale only what hits targets, pause what doesn’t.
🏆 Best for: New channels, new products, or new markets.
📈 Watch out for: Requires discipline and clear measurement.
If you’re still asking how much should a business spend on marketing, a simple starting point is to choose one primary method (goal-based or percentage of revenue), then use the test-and-scale approach to improve efficiency over time while determining the right marketing investment level.
How Often Should You Revisit Your Marketing Budget Percentage?
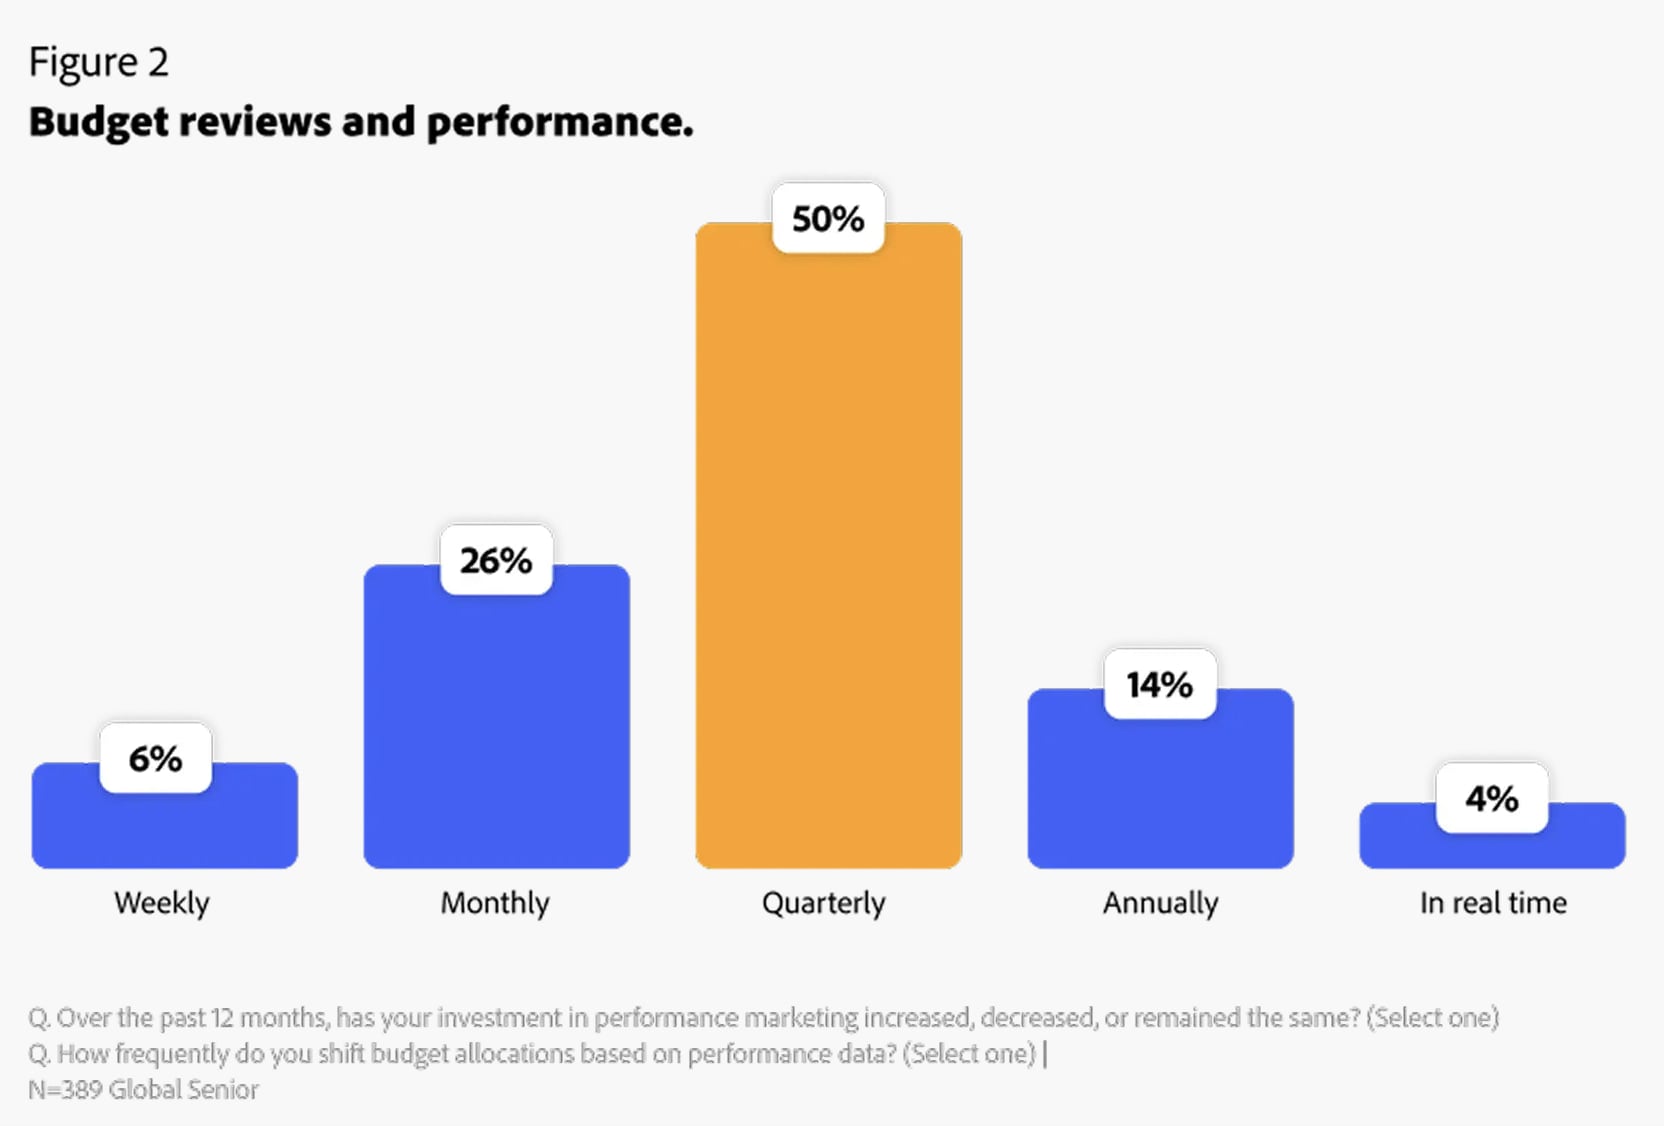
Most businesses should review their budget share of revenue on a regular schedule, then revisit sooner when something major changes. According to research from Adobe and MMA Global, 50% of marketers review budgets quarterly. This is especially important if your marketing investment level is shifting due to channel costs or expansion, since sustainable marketing investment depends on steady performance and disciplined marketing spending.
| Review timing | What you should check | Best for |
| Weekly | Channel pacing (are you overspending or underspending this week?) | Paid media-heavy programs |
| Monthly | Budget vs. actuals, lead quality, CAC trends, pipeline impact | Most teams running multiple channels |
| Quarterly | Update your budget percentage based on revenue performance and forecasts | Best default for most businesses |
| Annually | Full reset of goals, channel mix, and annual marketing budget | Strategic planning |
Revisit sooner if any of these happen
- Revenue forecast changes (up or down)
- Major goal shift (new market, product launch, aggressive growth target)
- Performance breaks (CAC spikes, conversion rates drop, lead quality declines)
- Market pressure (new competitor push, higher ad costs, seasonality swings)
Final Thoughts
There is no single “right” marketing percentage for every business. The best budget depends on your industry, company size, growth stage, and goals. Use benchmarks as a starting point, then choose a budgeting method that fits your situation, whether that is goal-based planning, unit economics, or a percentage of revenue. Finally, review your marketing budget percentage on a steady cadence and adjust when revenue, market conditions, or performance changes.